A JavaScript a modern webfejlesztés egyik nélkülözhetetlen építőköve, amely nem csupán az interaktív felhasználói felületek megteremtésében játszik kulcsszerepet, hanem az összetett adatok vizuális megjelenítésében is. A gráfvizualizáció egy olyan erőteljes technika, amely lehetővé teszi, hogy a relációkkal és kapcsolatokkal átszőtt adatokat intuitív és könnyen érthető formában tárjuk a felhasználók elé. Legyen szó szociális hálózatokról, szervezeti felépítésekről, tudásgráfokról vagy éppen komplex rendszerek monitorozásáról, a JavaScript alapú gráfvizualizációs megoldások elengedhetetlenek az adatok mélyebb megértéséhez és az értékes következtetések levonásához.
Miért Olyan Fontos a Gráf Vizualizáció a Modern Adatkezelésben?
A hagyományos táblázatos vagy listás formátumok gyakran nem elegendőek az adatok közötti komplex kapcsolatok feltárásához. A gráfok, amelyek csomópontokból (entitások) és élekből (kapcsolatok) állnak, sokkal természetesebb módon képesek reprezentálni ezeket a viszonyokat. A vizuális megjelenítés pedig segít az emberi agynak a minták, anomáliák és trendek gyorsabb és hatékonyabb azonosításában. A JavaScript gráfvizualizációs könyvtárak segítségével dinamikus és interaktív vizualizációkat hozhatunk létre közvetlenül a böngészőben, így a felhasználók valós időben fedezhetik fel az adatokat.
A JavaScript Gráf Vizualizáció Főbb Alkalmazási Területei
- Szociális Hálózatok Elemzése: A felhasználók közötti kapcsolatok, befolyásolók azonosítása.
- Szervezeti Ábrák: A vállalati hierarchia, a különböző részlegek közötti viszonyok megjelenítése.
- Tudásgráfok: Fogalmak közötti kapcsolatok, szemantikus hálózatok feltárása.
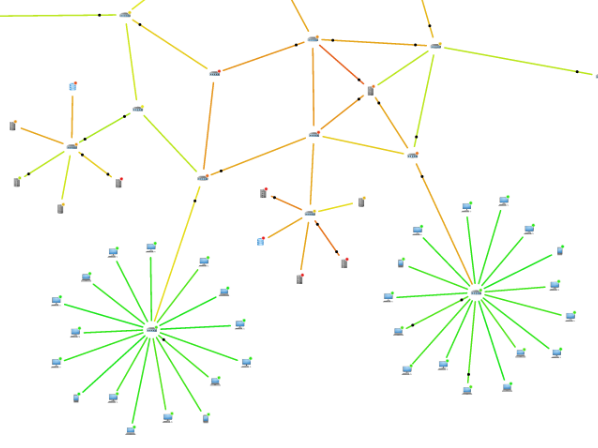
- Hálózati Infrastruktúra Monitorozása: Eszközök, szerverek közötti kapcsolatok, adatforgalom vizualizációja.
- Ajánlórendszerek: Felhasználók és termékek közötti interakciók, hasonlóságok megjelenítése.
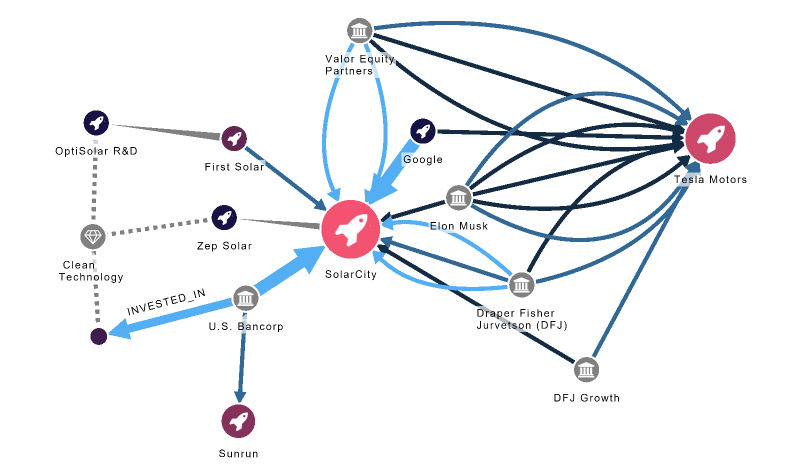
- Pénzügyi Tranzakciók Elemzése: Csalárd tevékenységek, pénzmozgások nyomon követése.
- Biokémiai Hálózatok: Molekulák, reakciók közötti komplex kapcsolatrendszerek ábrázolása.


A Legnépszerűbb JavaScript Gráf Vizualizációs Könyvtárak
A JavaScript ökoszisztéma számos kiváló könyvtárat kínál a gráfok vizualizációjához. Ezek a könyvtárak különböző funkciókat és testreszabási lehetőségeket biztosítanak, így minden projekt számára megtalálható a megfelelő eszköz.
- D3.js (Data-Driven Documents): Egy rendkívül rugalmas és erőteljes könyvtár, amely alacsony szintű hozzáférést biztosít a SVG, Canvas és HTML elemekhez. Bár nem kifejezetten gráfokra specializálódott, a D3.js-szel bármilyen egyedi vizualizáció megvalósítható, beleértve a komplex gráfokat is.
- Cytoscape.js: Egy dedikált gráfvizualizációs könyvtár, amely számos elrendezési algoritmust, interakciós lehetőséget és stílizálási opciót kínál. Kiválóan alkalmas nagy és komplex gráfok megjelenítésére is.
- Vis.js: Egy könnyen használható könyvtár, amely két fő modult kínál: a Network (gráfokhoz) és a Timeline (idősorokhoz). A Vis.js egyszerű API-val rendelkezik, és gyorsan lehet vele interaktív gráfokat létrehozni.
- Sigma.js: Egy WebGL alapú gráfvizualizációs könyvtár, amely kiemelkedően jó teljesítményt nyújt nagyon nagy gráfok megjelenítésekor is. Számos beépített funkcióval és pluginnal rendelkezik.
- ECharts: Az Apache ECharts egy átfogó vizualizációs könyvtár, amely számos diagramtípust támogat, beleértve a gráfokat is. Gazdag testreszabási lehetőségeket és interaktív funkciókat kínál.
Hogyan Válasszunk a Különböző Könyvtárak Közül?
A megfelelő könyvtár kiválasztása a projekt egyedi igényeitől függ. Vegyük figyelembe a következő szempontokat:
- A gráf mérete és komplexitása: Nagy gráfokhoz a teljesítményoptimalizált könyvtárak (pl. Sigma.js) lehetnek ideálisak.
- A szükséges interaktivitás szintje: Egyes könyvtárak több beépített interakciós lehetőséget kínálnak (pl. húzás, nagyítás, csomópont-információk).
- A testreszabás igénye: Ha egyedi megjelenésre van szükség, a rugalmasabb könyvtárak (pl. D3.js) lehetnek a legjobb választás.
- A fejlesztési idő és a tanulási görbe: Egyes könyvtárak könnyebben elsajátíthatók és gyorsabban lehet velük eredményt elérni (pl. Vis.js).
- A közösség és a dokumentáció: Egy aktív közösség és jó dokumentáció nagyban megkönnyíti a fejlesztést és a hibaelhárítást.
A Gráf Vizualizáció Lépései JavaScriptben
- Adatgyűjtés és -előkészítés: A gráf vizualizációjának első lépése a releváns adatok összegyűjtése és a megfelelő formátumba alakítása. Ez általában csomópontok (azonosítóval és opcionális tulajdonságokkal) és élek (forrás- és célcsomóponttal, valamint opcionális tulajdonságokkal) formátumot jelent.
- A könyvtár kiválasztása és integrálása: Válasszuk ki a projektünk igényeinek leginkább megfelelő JavaScript gráfvizualizációs könyvtárat, és integráljuk azt a webprojektünkbe (általában egy `
- A gráf adatainak definiálása: Hozzunk létre egy JavaScript objektumot vagy tömböt, amely tartalmazza a gráf csomópontjait és éleit. A formátum a kiválasztott könyvtár API-jától függ.
- A vizualizációs beállítások konfigurálása: Szabjuk testre a gráf megjelenését, beleértve a csomópontok és élek stílusát (szín, méret, alak, vastagság), az elrendezési algoritmust (pl. erő-vezérelt, körkörös, hierarchikus), és az esetleges interakciós funkciókat.
- A gráf renderelése: Használjuk a kiválasztott könyvtár API-ját a gráf adatainak és beállításainak átadásához, és rendereljük a vizualizációt egy kijelölt HTML elemben (pl. egy `
` vagy `
- Interaktivitás hozzáadása (opcionális): Implementáljunk olyan interaktív funkciókat, mint a csomópontok húzása, nagyítás/kicsinyítés, csomópontokra kattintva részletes információk megjelenítése, vagy éppen szűrési lehetőségek.
A JavaScript gráfvizualizáció egy hatékony eszköz az összetett adatok megértéséhez és kommunikálásához. A rendelkezésre álló számos kiváló könyvtárnak köszönhetően a fejlesztők könnyedén hozhatnak létre lenyűgöző és interaktív adatmegjelenítéseket közvetlenül a webböngészőben. Legyen szó akár üzleti elemzésről, tudományos kutatásról vagy éppen felhasználói élmény javításáról, a gráfvizualizáció új perspektívákat nyit meg az adatok világában.

